
A s we drift away from the times of incandescent lighting – using an illuminated filament as a light source – we have seen a decline in the quality of light around us. From offices cast in a green and grey hue due to the use of compact florescent lighting (CFL) to the early days of LED’s which were dim and blue, these energy-conscious decisions left everyone thinking, “is this really the best we can do?” Why is color rendering important?
While there was light, the quality of light was severely lacking.
Accountability came in the form of a Color Rendering Index (CRI) by way of defining colorimetry and corrected color temperatures (CCT). And while CRI is still regarded as a great standard for measuring the quality of light produced by a light source it doesn’t come without criticism:
- Light sources with similar CRI may perform significantly different than one another.
- Only luminaires producing a “white light” can be measured for CRI.
- The sample size of color panels is just not large enough to form an accurate representation.
…along with many others
These issues are valid and lead to the question, “is there a better way to measure a luminaire?”
What is TM30?
TM30 is not one single metric, but rather a set of tools that when analyzed as a whole provides a better indication of overall color rendition based on observations of common colors seen in everyday objects. What does that mean exactly? TM30 compares the color fidelity (Rf) (color accuracy) and color gamut (Rg) (saturation) of how a light source compares to a “perfect” reference, ex. a blend of sunlight and incandescent light at around 5000K.
The Core Figures:
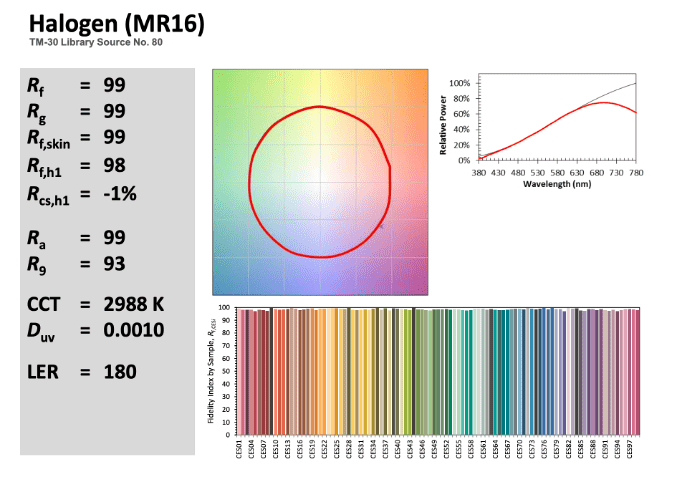
fig 1
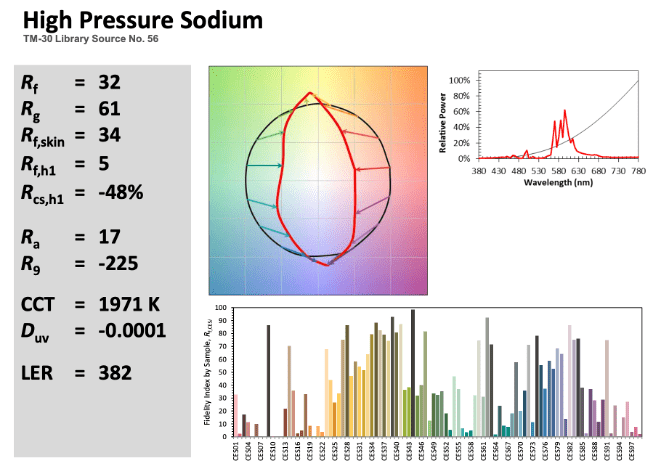
fig 2
Fidelity (Rf)
Looking at the figures above, we see quite a bit of information, let’s break it down.
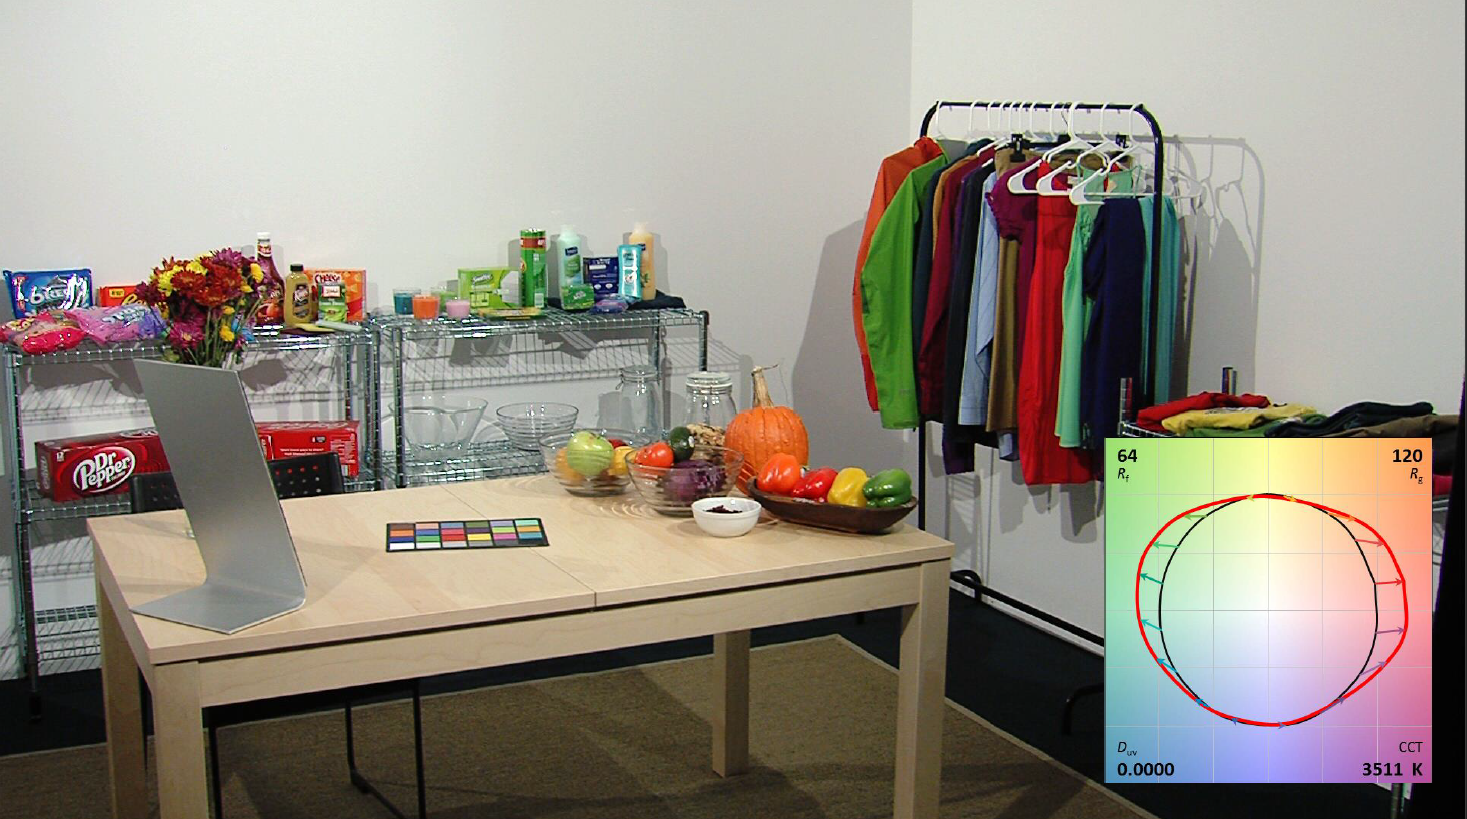
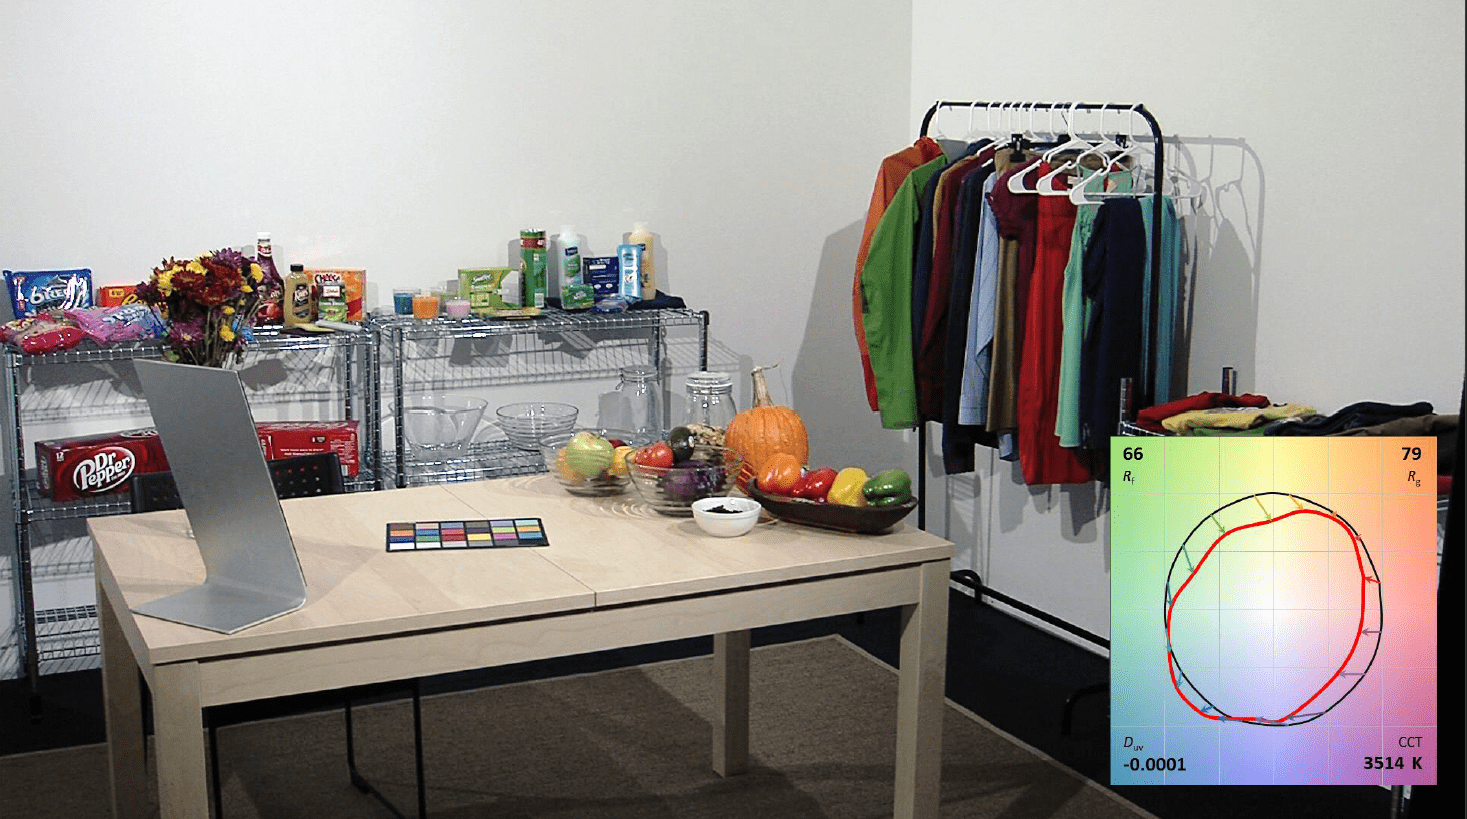
Figure 1 is an analysis of a halogen MR16 and Figure 2 is the analysis of a high-pressure sodium luminaire. The dark circle in the middle of the colored graph is a reference representation of “perfect” color rendering across the visible spectrum and the red circle notates how the tested light source performed in the TM30 test. The halogen MR16 in figure 1 is just about a perfect match for fidelity (color accuracy to the reference) as the dark reference circle is not visible, whereas the high pressure sodium luminaire in figure 2 is showing significant desaturation and hue shifts throughout the visible spectrum, otherwise poor fidelity.
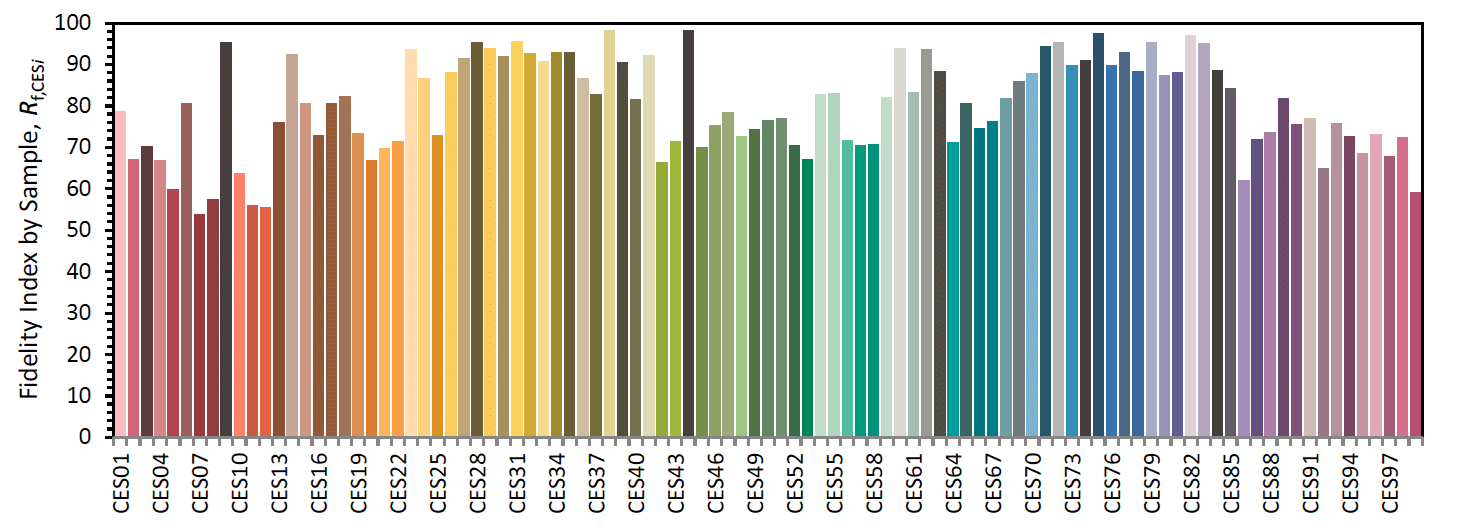
A bar chart is displayed at the bottom of the TM30 report represents 99 color samples from common objects and how they would be perceived compared to the reference luminaire. These colors are averaged into 16 groups or ‘bins’ of color that make up zones around the circle. The closer to 100 these colors are on the fidelity (Rf) scale, the more accurate they are to the reference colors. These common colors are the basis of the overall TM30 test score.
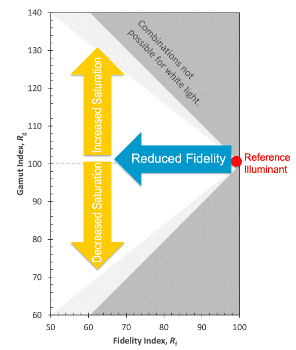
fig 3
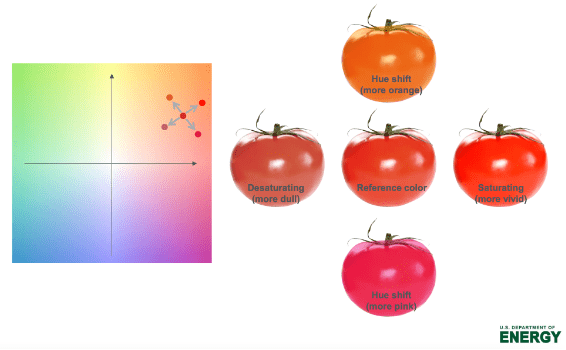
fig 4
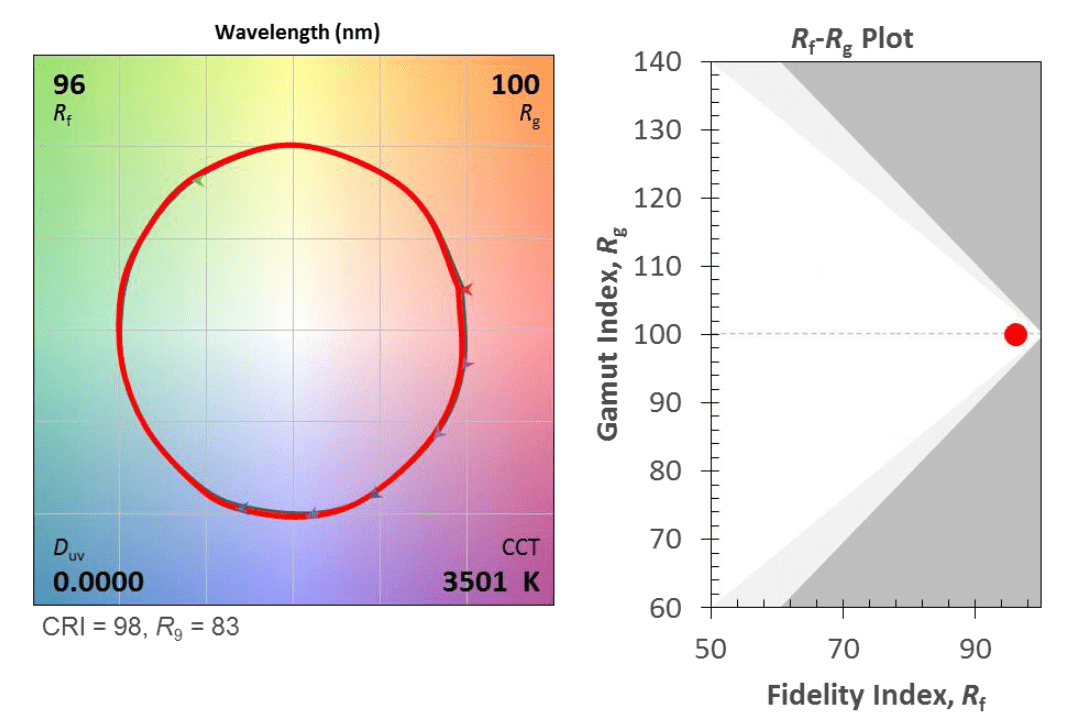
fig 5
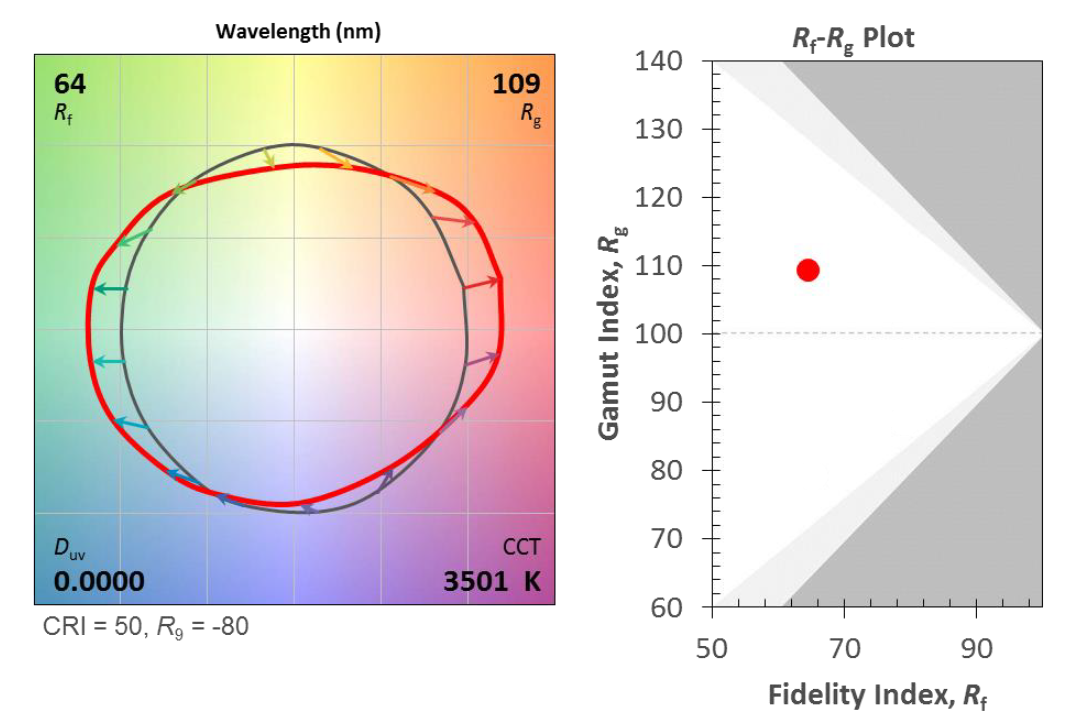
fig 6
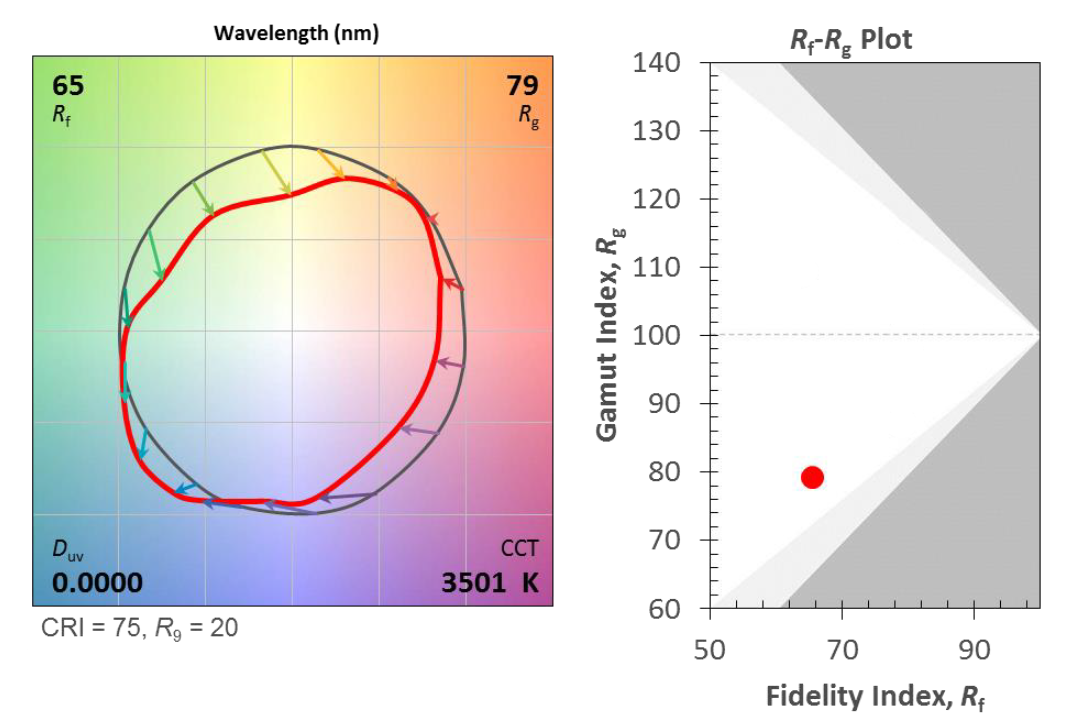
fig 7
Gamut (Rg)
Gamut (Rg) referenced in figure 3 is the variable that shows how saturated a light source is. The fidelity is captured from the Rf scale and displayed on the X axis. Saturation data is displayed on the Y axis. The closer this value is to 100, the closer it is to the reference luminaire. If the gamut were higher than 100 on the Y axis, it would be considered higher saturation in some colors, and if it were less than 100, it would be considered undersaturated, or a poorer source of light – compared to the reference.
Along with saturation, the vector graphic can show how colors are hue shifted (figure 4). Consider the reference circle, if a point was moved directly into the center of the graph or directly away from the center, saturation would be increased or decreased. However, if the point is shifted perpendicularly left or right from the reference point, that would create a hue shift. In a nutshell, if the vector graphic is less than a perfect circle from the reference, it has had a hue shift in one form or another from the 16 reference points.
As additional examples, take a look at figures 5 – 7, the point at which these light sources fall on the RfRg plot indicates how accurate they are to the reference. Figure 5 shows an accurate source of light with a high Rf value. If you were interested in a more color-accurate appearance, you would want your Rf and Rg values to be close to 100. Figure 6 shows a light source with higher saturation values, but low accuracy. This higher gamut may be desirable if you wish for certain colors to “pop” and stand out. Figure 7 shows a poor light source with low accuracy, but also low saturation.
Just knowing the gamut value doesn’t tell you the whole story on which colors are more or less saturated. Two light sources could have the same Rg value, however, have a very different look. This is where we rely on the gamut to shape the fidelity circle to more accurately display saturation and hue data of the test luminaire.
It is important to note that fidelity and gamut are correlated. As your fidelity of light is reduced from the reference, the gamut index can become either more or less saturated.
Left: High Gamut, Right: Low Gamut
The two most important variables with TM30 are the Fidelity (Rf) and Gamut (Rg) variables of a luminaire.
Scratching the Surface
While there is plenty more to learn, the intent of the article is to provide a basic understanding of the principles surrounding TM30 and how to interpret TM30 data. CRI is good to know and will continue to be used, however, TM30 has the potential to become more of a standard in luminaire output analysis in the future. By utilizing dozens of real-world colors, TM30 does a better job at providing more applicable data to work with when deciding on the appropriate light for your needs. If you have any additional questions about TM30 or CRI, or any of our products, don’t hesitate to reach out to us.
All images courtesy Energy.gov